Linear Referencing Exercise
Problem: We would like to gain an understanding of the accidents that occur on a particular route segment and whether pavement conditions were a contributing factor to those accidents.
Analysis Procedures:
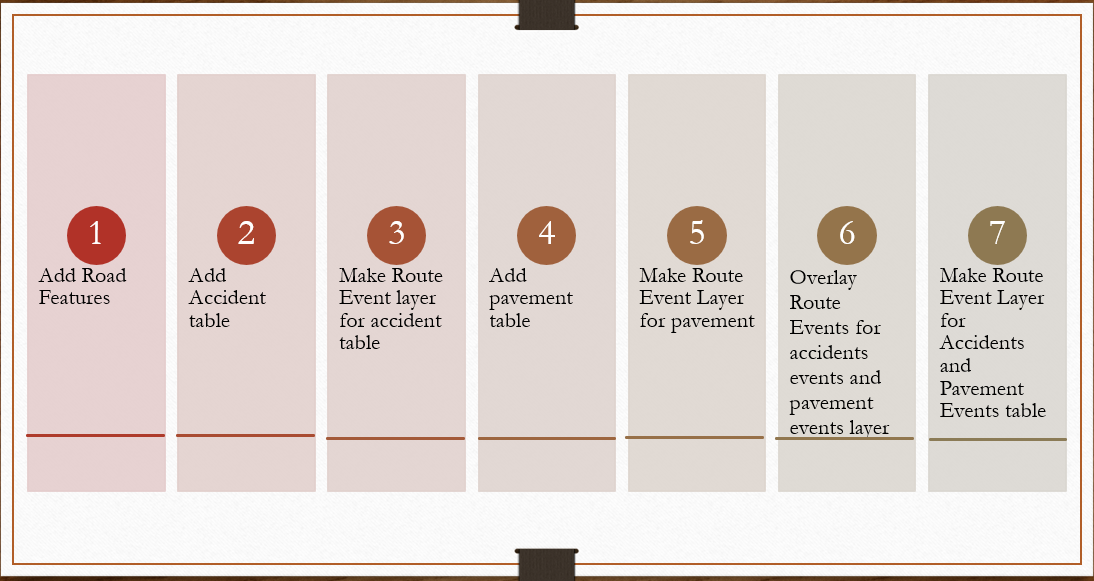
This problem will be solved using step by step exploration of the data tables and linear referencing techniques such as the identify route locations, make route event layer, and overlay route event layer tools. ArcCatalog and ArcMap were the only software used in this exercise and the data was obtained directly from the NCSU GIS 520 course.
The general procedure for solving this problem was to first explore the two tables that I would be intersecting in ArcCatalog. Once the data was sufficiently explored I added the layer that I would use to reference to ArcMap and explored our route of interest. I then added the accidents table to the table of contents. To display this on the map I used the “make event route Layer” tool to show accident events. I then repeated this process with the pavement table. To explore the connection of road conditions and accidents I needed to intersect the route events. To do this I used the “overlay route events” tool. Finally, I created a route event layer for the resulting table in the preceding step.
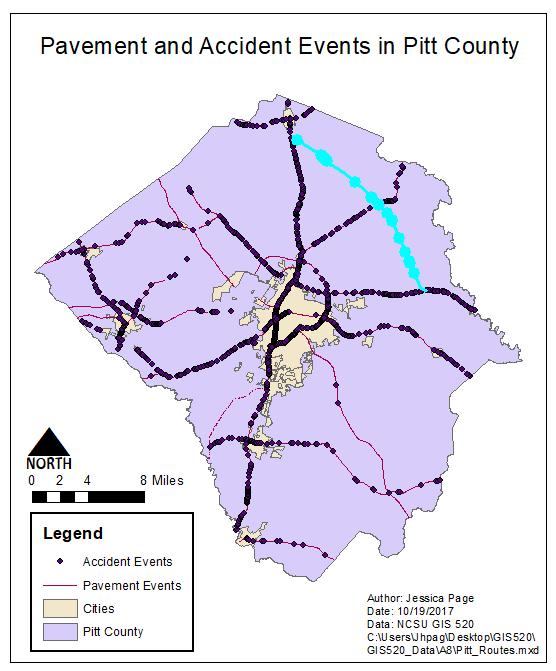
Results: This exercise was explicitly a question and answer worksheet the following map depicts the selected routes that were referenced to answer questions for this exercise.
Application and Reflection: This exercise is especially helpful in determining how different factors along recorded routes may be correlated.
Problem Description: A different kind of problem that we would use the skills learned in the exercise for is if you were a deer biologist for the state of North Carolina who wanted to get to understand to root cause of deer collisions along certain roadways using reported roadkill incidents across the state. Though you suspect that rate of collision is more directly correlated with surrounding landcover, you would like to first see how speed limits along roadways may factor into your analysis.
Data Needed: In this scenario you have incident data for road kills. You will also need Roadway information which is available through the NCDOT website.
Analysis Procedures: You have decided to conduct your analysis from a random sampling of roadways in North Carolina. Following the same procedure from the exercise you will make a route event layer for you r roadkill incident data. Speed limit data is available within the shapefile and so there are no route events that need to be intersected.
Additional Resources from ESRI:
<Go Back To Spatial Pattern Analysis Go Forward to Raster Data-Site Selection>