Working with US Census Data: American Fact Finder and TIGER/lines ®
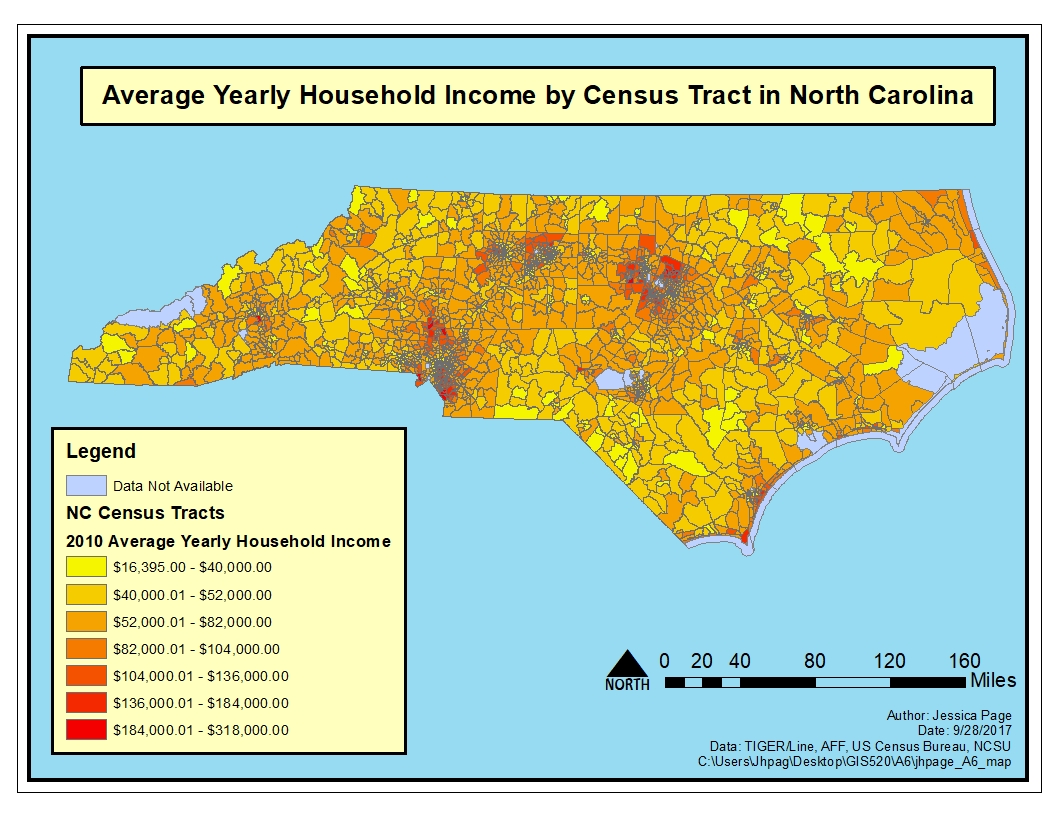
Problem:In this assignment we needed to make a map that would theoretically fit with a series of maps for the office of State Human Resources. I chose to map how incomes per household were distributed throughout North Carolina. I choose to map this by census district as this would give us a more accurate assessment as opposed to simply mapping average income by county. The data table the I used was “INCOME IN THE PAST 12 MONTHS (IN 2015 INFLATION-ADJUSTED DOLLARS) 2011-2015 American Community Survey 5-Year Estimates” with the code S1901.
Analysis Procedures: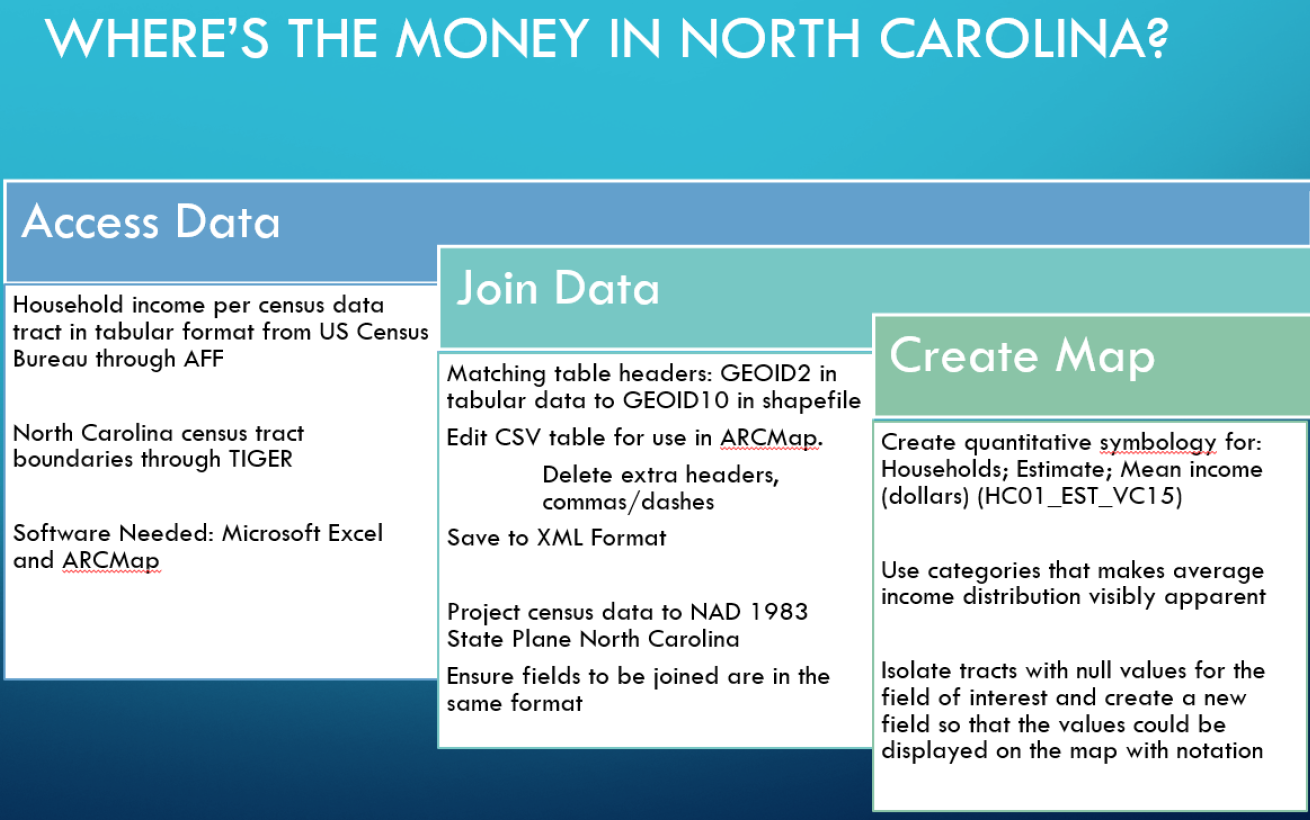
To solve this problem, the user is required to use Microsoft Excel and ARCMap. Data must be acquired through the AFF US Census Bureau and through TIGER. In this example the US census data must be downloaded as a csv table and TIGER data is a shapefile. Using Excel the user will prepare the CSV table to be joined to the TIGER datafile to create a map.
Once the necessary datafiles are downloaded and saved, the user should open the csv and prepare it for joining in ARCMap by saving it as an xls table. The extra header should be removed and commas and dashes should be removed from the remaining headers. Both files can then be brought into ARCmap and the shapefile should be projected to NAD Stateplane 1983 North Carolina US Feet (or meters). Our field of interest in the shapefile is GEOID10 which is a string field. This directly corresponds to GEOID2 in the xls table. However, GEOID2 is a double field type (numeric). Since I was unable to change this outside of ARCGis I choose to create a new field in the attribute table of my shapefile and repopulate the GEOID10 values as field type: double. The xml table was then joined to the shapefile and checked for issues. To create the map or any variation of this map from the income data, the user may use the symbology field. I chose the “Households; Estimate; Mean income (dollars)” (HC01_EST_VC15) the show the average income of households within each census tract. Once this was done I could pinpoint where my null values were located and troubleshoot. No census data was available for some regions so I created a new layer of my null values so that they could be displayed on the map and within my legend.
Results:
Application and Reflection:
This assignment provided the basis for solving larger and much more complicated social geospatial problems because we are learning to tie data tables with shapefiles as well as locate and utilize census data. Although I do not currently need use of census data for my current work, this skill set will be important of I continue to work for the city.
Problem Description: A good example of this is if I wanted to examine the socioeconomic implications of food deserts. One problem we could solve using information from the US Census Bureau is how do grocery stores per capita relate to the household incomes of people in those same areas. Specifically, we would like to examine this relationship in Wake County.
Data Needed: Like the previous exercise, data must be acquired through the AFF US Census Bureau and through TIGER. Businesses are classified by type from the US census bureau.
Analysis Procedures: To solve this problem we would need to further build on the previous exercise. However, we would need to also map the number of grocery stores per census district and then perform a spatial join. We would then use the field calculator to create an index of income to census district.
Additional Resources:
- American Fact Finder Census
- 2010 TIGER/Line® Shapefiles
- Understanding how to use Microsoft Excel files in ArcGIS
<Go Back to Data Cardinality Go Forward to Spatial Pattern Analysis>